What a qEEG Brain Map Shows
A qEEG brain map turns your brain's electrical activity into a clear, color-coded picture. Here is what it measures, what the colors mean, and what it can and cannot tell you.
Medically reviewed by Dr. Cindy Morrey, DC · June 30, 2026
Before any training begins at Source Neurofeedback, we start with a picture. A qEEG brain map turns the brain’s electrical activity into a color-coded snapshot of its rhythms. Here is what that map measures, what the colors mean, and just as importantly, what it cannot tell you.
How a brain map is made
A qEEG, short for quantitative EEG, is a detailed recording of your brainwaves. Soft sensors rest on your scalp and listen to the tiny electrical signals your neurons make as they communicate. Nothing is sent into your brain. The sensors only read, the way a stethoscope listens to a heartbeat. We record with your eyes open and again with them closed, because the brain behaves differently in each, and the whole thing takes about an hour.
Your brain runs on rhythms
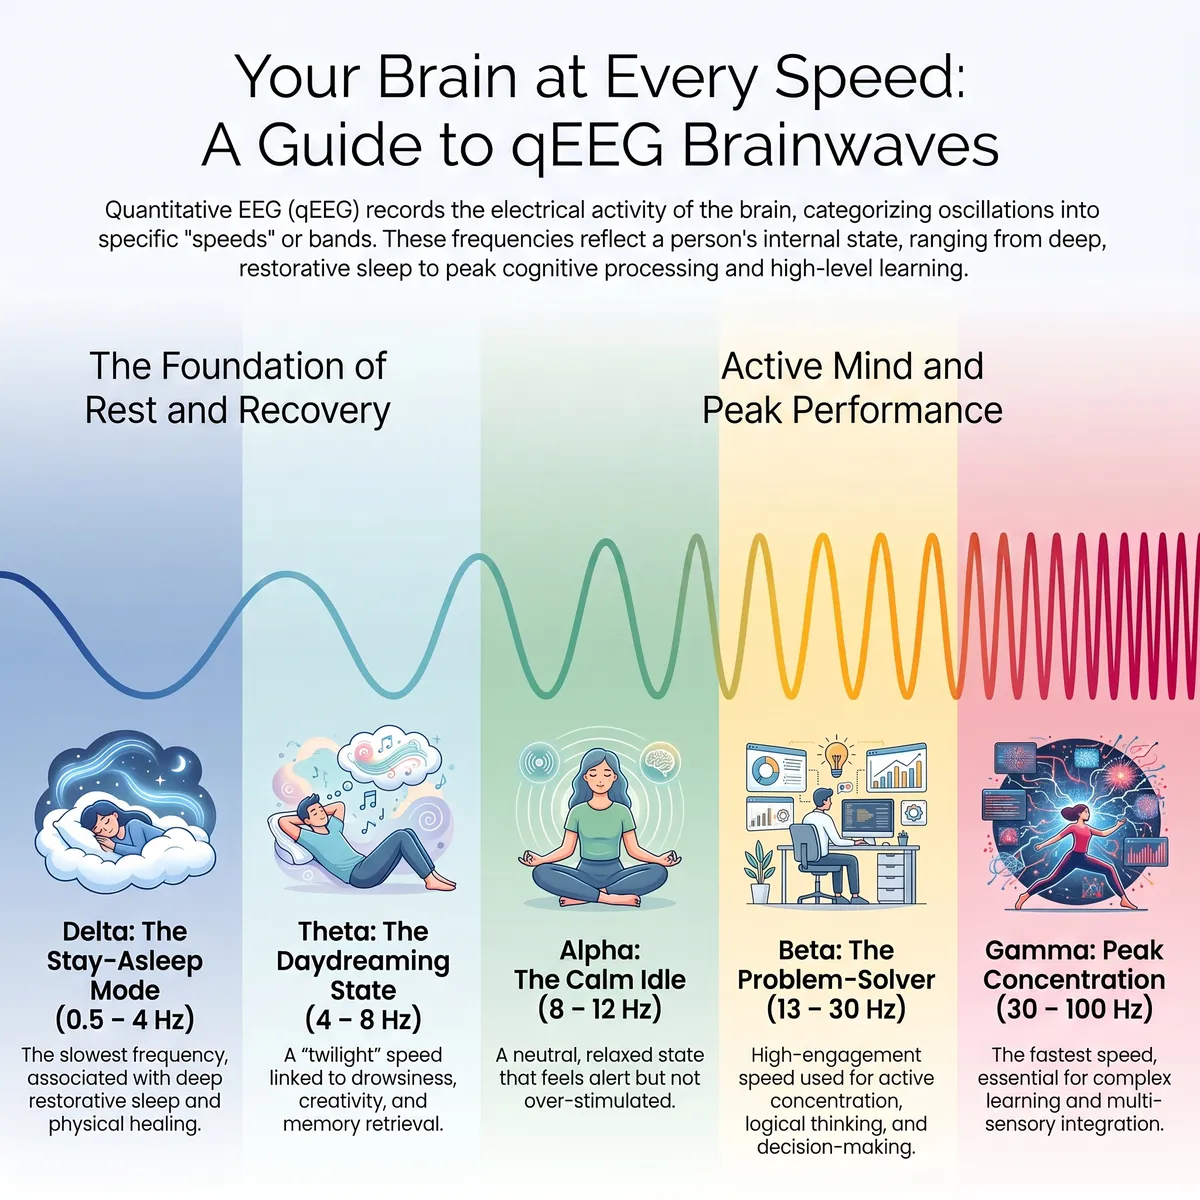
Those signals rise and fall in rhythms, which we group into bands by speed, measured in cycles per second (hertz). The exact cutoffs shift a little from one clinician or database to the next, but the rough picture looks like this, and each band tends to take the lead in a different state:
- Delta (0.5 to 4 Hz) is the slow, heavy rhythm of deep, restorative sleep.
- Theta (4 to 8 Hz) shows up in drowsiness, daydreaming, and memory. An excess of it during the day is a pattern we often see alongside attention and focus struggles.
- Alpha (8 to 12 Hz) is the calm, relaxed-but-alert idle, strongest when you close your eyes. Disrupted alpha can track with anxiety and slow stress recovery.
- Beta (12 to 30 Hz) is the busy rhythm of focus and problem-solving. It tends to take the lead when you are on task, while too much fast beta can come with racing thoughts and trouble winding down at night.
- Gamma (above 30 Hz) is the fastest of all, often associated with peak concentration and learning.
A brain map measures how much of each rhythm shows up, and where on the scalp. They are the same five bands we visualize on our home page.
What the colors mean
On its own, a raw recording is just wavy lines. The quantitative part is what turns it into a map: your activity is compared with a normative database of brains around your age. The software then paints a color-coded picture, region by region, of where a rhythm is running higher or lower than typical. Green usually means activity sits in the typical range, warm colors (reds and oranges) flag activity that is elevated, and cool colors (blues) flag activity that is low. The point is not to label you. It is to show where the brain looks over- or under-regulated, so a training plan can aim at something specific instead of guessing.
What a qEEG brain map can, and cannot, tell you
A qEEG brain map is a training tool, not a diagnosis. It does not diagnose ADHD, anxiety, depression, or any medical condition, and it is not a substitute for a clinical evaluation. Plenty of everyday things, from a short night of sleep to caffeine, can nudge a recording. We use the map to guide neurofeedback and to work alongside your medical and mental health care, never in place of it.
What it can do is give us, and you, a starting point grounded in your own brain rather than a generic protocol. Seeing your patterns on screen tends to make the whole process feel a lot less abstract, and a lot more like something you can actually work on.
From map to plan
A brain map is the first step, not the destination. Once it is done, you sit down with Dr. Cindy Morrey for a results review, a plain-English walk through what the map shows and what it means for your goals. From there we build a training plan around the specific rhythms and regions that stand to benefit.
If you have ever been curious about your own patterns, a brain map is a good place to start.
Common questions
Does a qEEG brain map hurt?
Not at all. It is completely painless and non-invasive. Soft sensors rest on the scalp and only read the electrical activity your brain is already producing. Nothing is sent into your brain, there are no needles, and there is no medication involved.
Can a qEEG brain map diagnose a condition?
No. A qEEG brain map is a training tool, not a diagnosis. It does not diagnose ADHD, anxiety, depression, or any medical condition, and it is not a substitute for a clinical evaluation by a qualified provider. We use it to guide neurofeedback and to work alongside your existing care.
How long does a brain map take?
Plan on about an hour. We record your brainwaves with your eyes open and again with them closed, since the brain behaves differently in each state, and that comparison is part of what makes the map useful.
Do I need a brain map before starting neurofeedback?
At Source Neurofeedback, yes. The map is how we build a plan around your own brain instead of a one-size-fits-all protocol. It also gives you a clear before-picture to look back on as training progresses.
Curious what your brain map would show?
Book a qEEG brain map and results review. We’ll show you exactly what’s going on, and build a drug-free plan to help.